React Data Display and Feedback Components
The Data Table handles sorting, search, row selection, bulk actions, column visibility and pagination with TanStack Table. Charts cover area, bar and donut, KPI cards and sparklines, each with a data table for screen readers.
Badges and states fill the gaps between: empty, error, success and loading screens, each with a title, a sentence and one action, plus skeletons.
8 components, 8 free. React, TypeScript and Tailwind CSS, light and dark.
How to build a React dashboard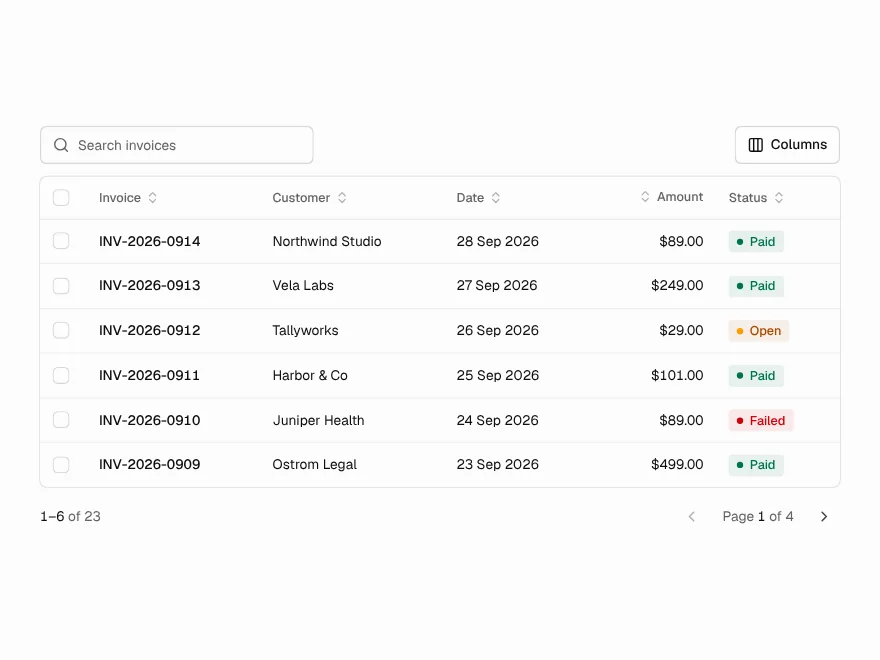
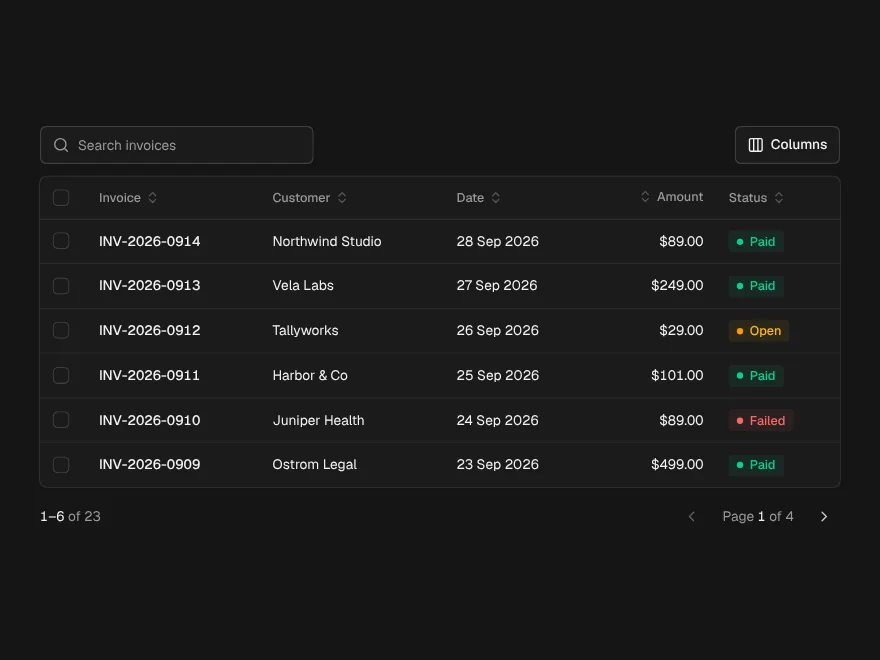
Data Table
FreeTanStack table with sorting, search, row selection, bulk actions, column toggle and pagination.
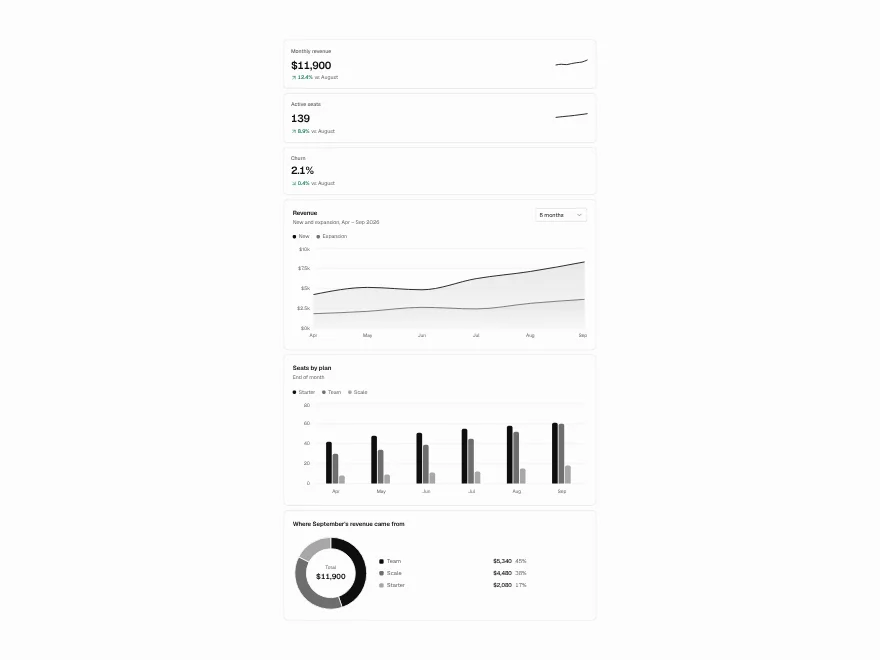
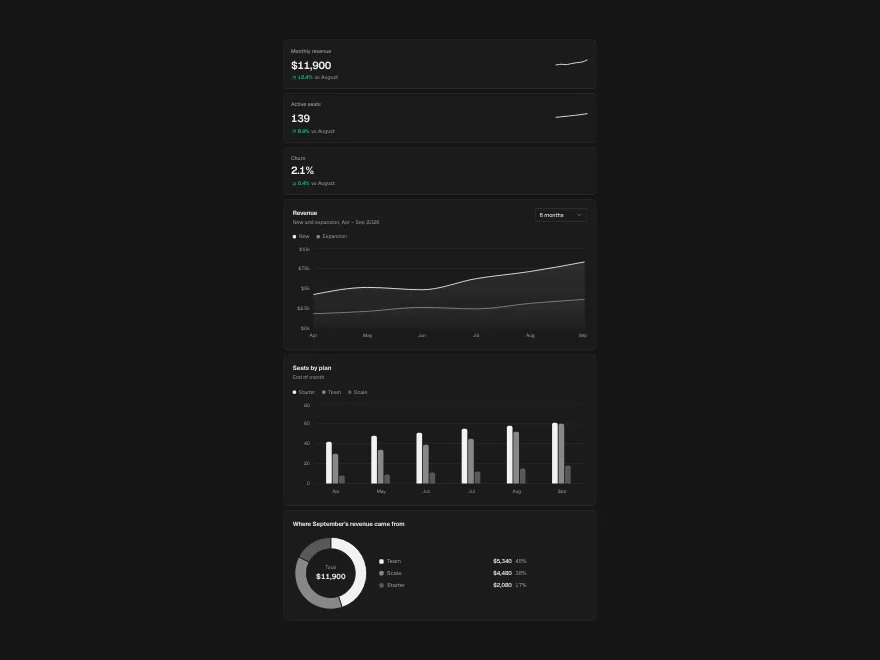
Charts
FreeArea, bar and donut charts, KPI cards and sparklines, each with a data table for screen readers.
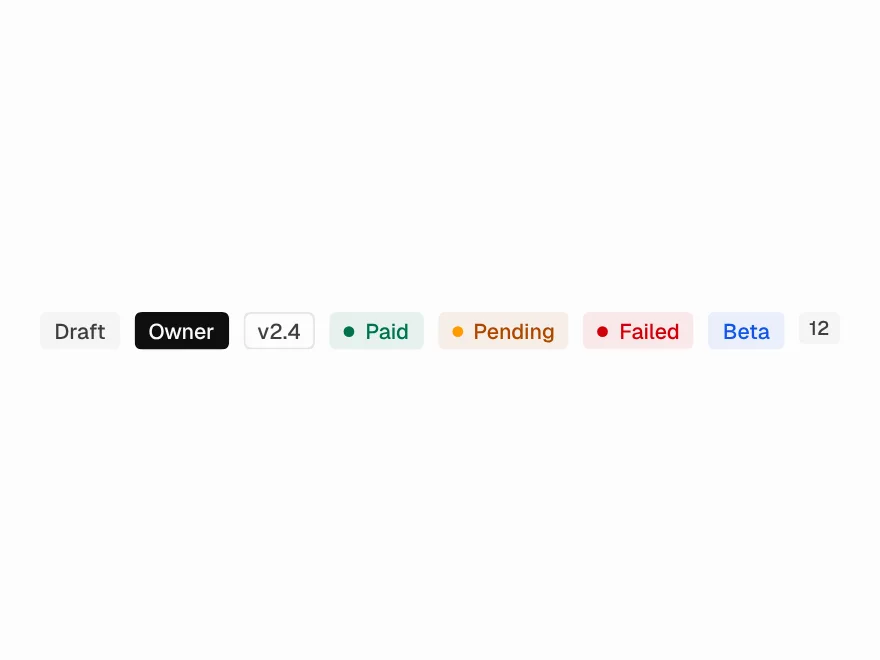
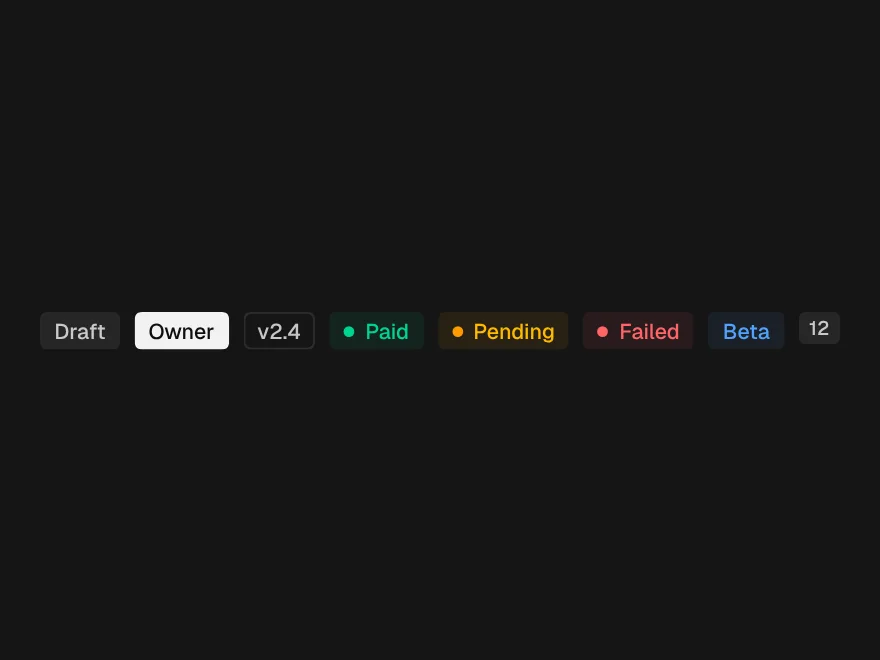
Badge
FreeStatus labels in seven tones with an optional dot.
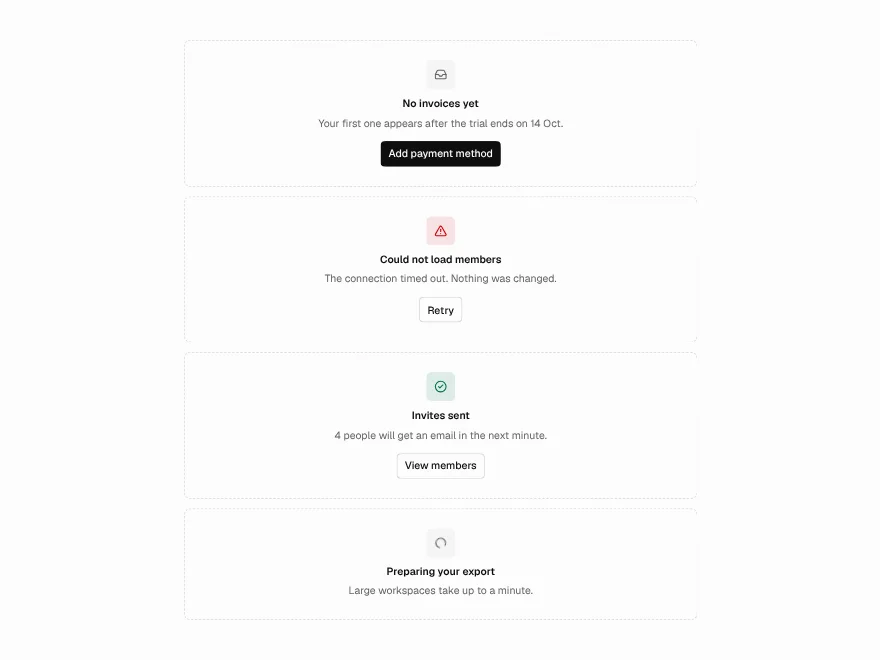
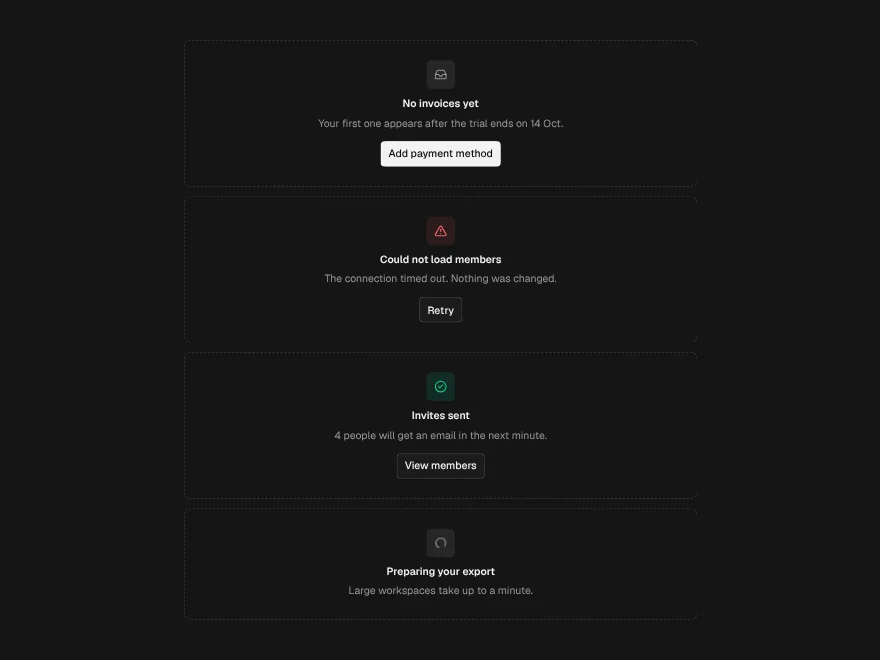
Empty & Loading States
FreeEmpty, error, success and loading states, plus skeletons.
Alert
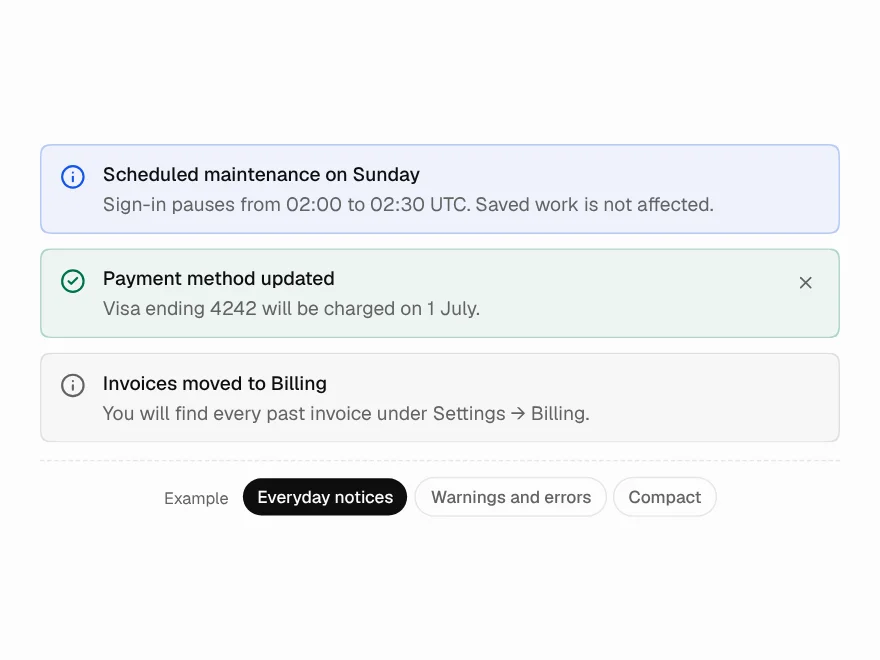
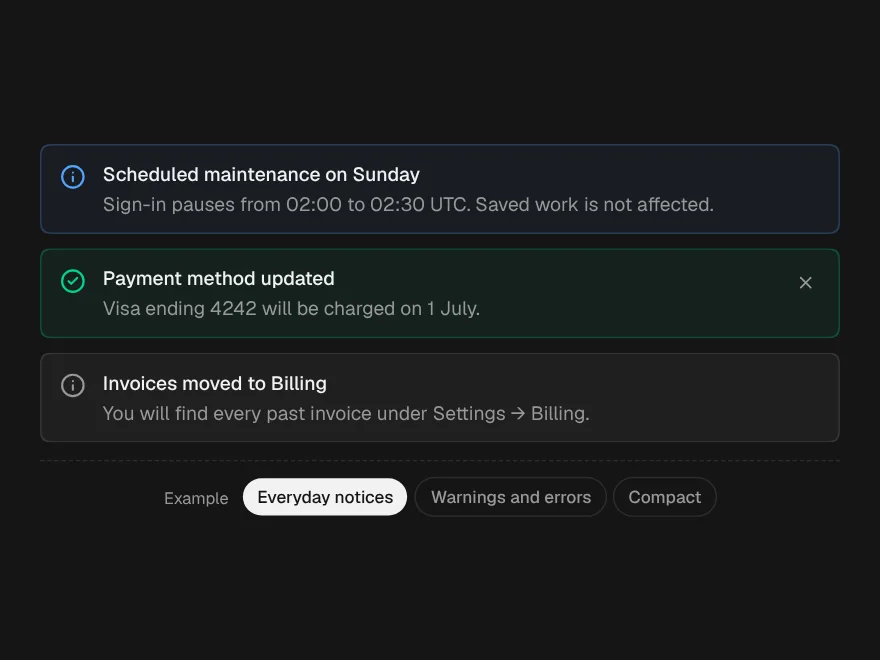
FreeAn inline notice in five tones, with one action and an optional close.
Progress Bar
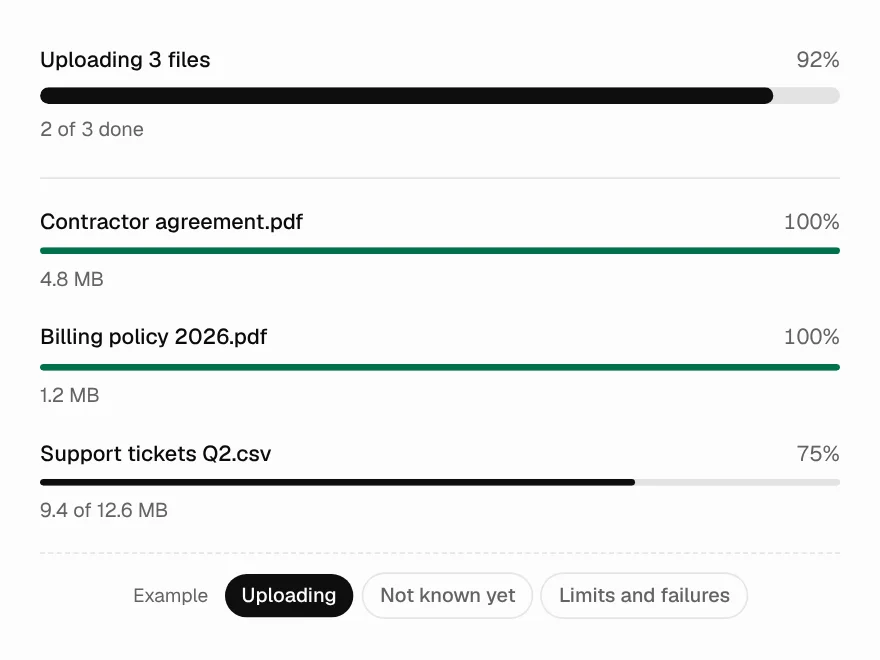
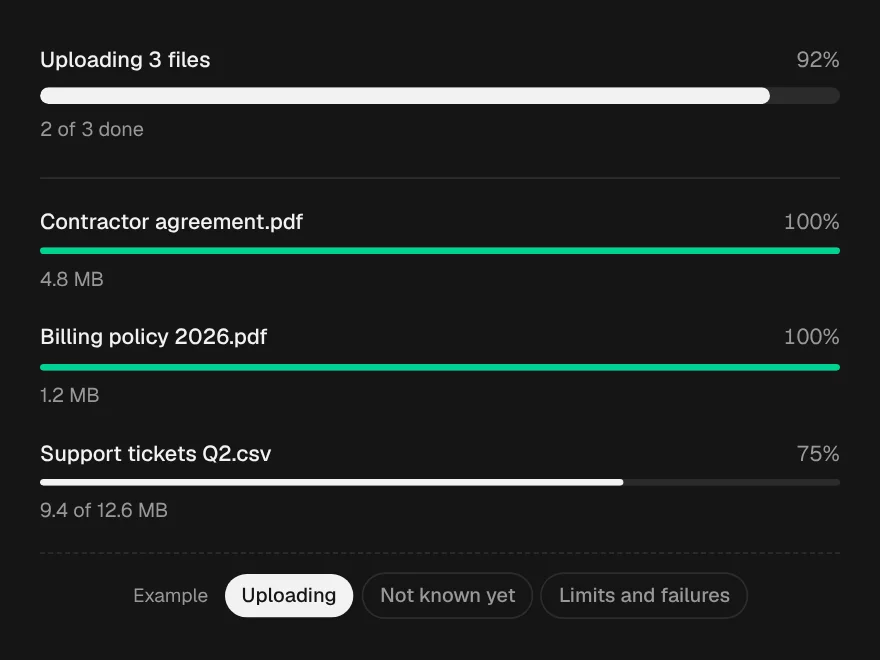
FreeA progress bar, determinate or not, grey until colour means something.
Progress Circle
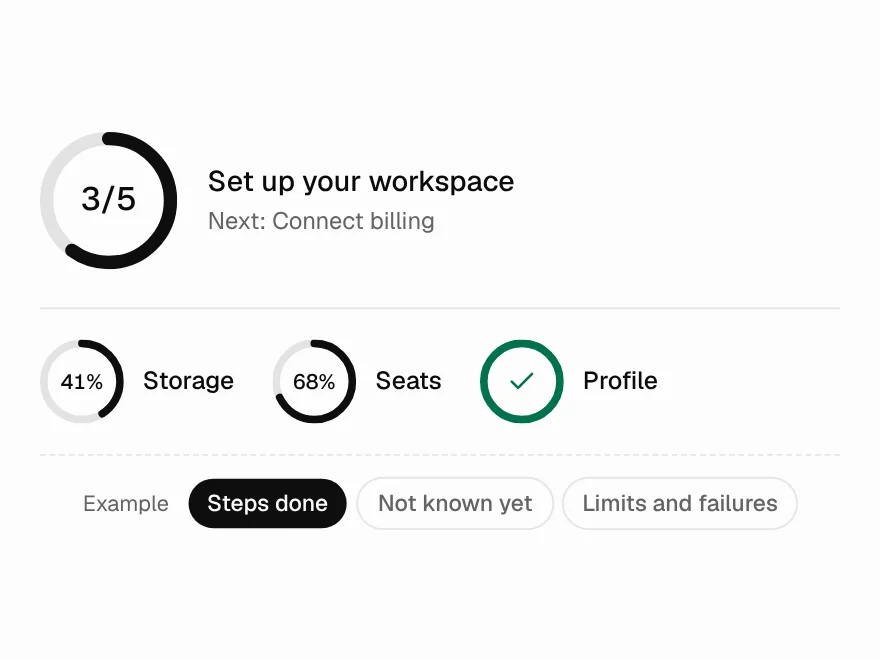
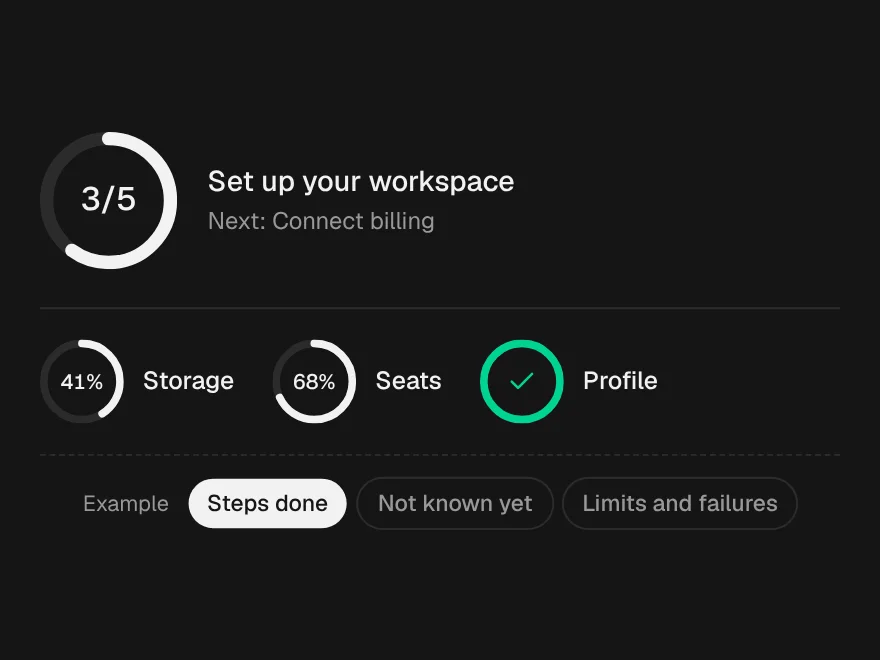
FreeA progress ring for tight spots, from a 16px spinner to a step counter.
Dashboard
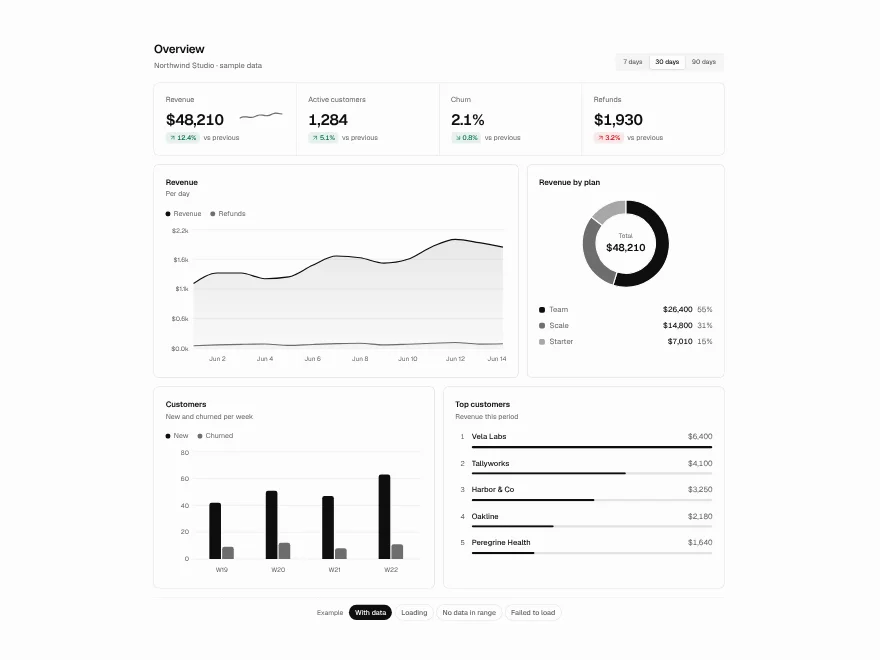
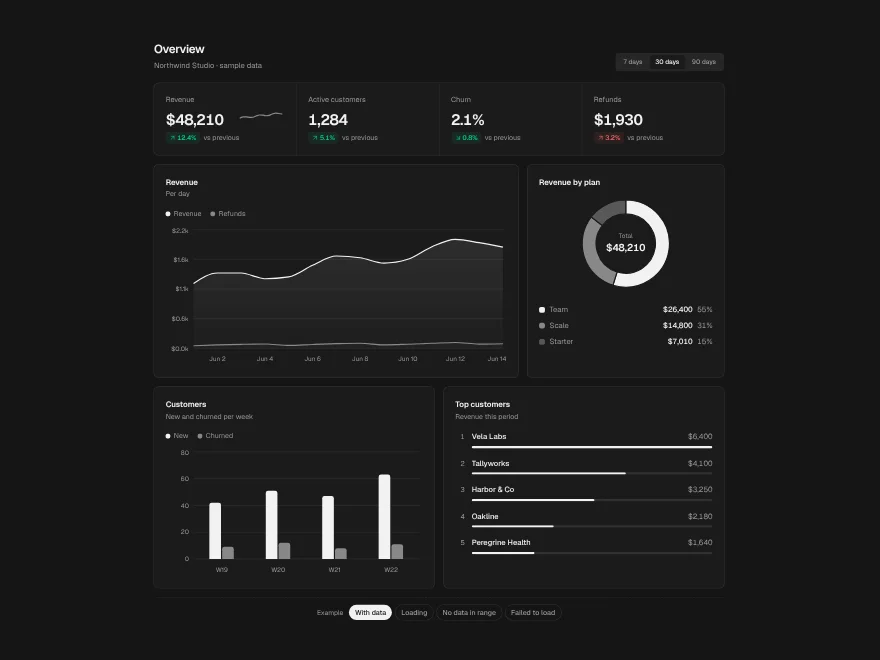
BlockFreeA whole overview screen: KPIs, trend, breakdown, comparison and a ranked list on one date range.